October 28, 2025
What are Sparklines?
4.9 (217)
A sparkline is a small chart located inside a single cell that displays data trends, such as seasonal ups and downs, cycles, or highs and lows. They are best placed near the data they represent. How to Add a Sparkline
Related reading
Want to test several conditions in a single formula? Combine the IF and AND functions!
How to Convert JPG to a Word Document Online?
Ever been blocked from sending image files? Converting JPGs to editable Word documents (DOCX) is often the simplest fix.
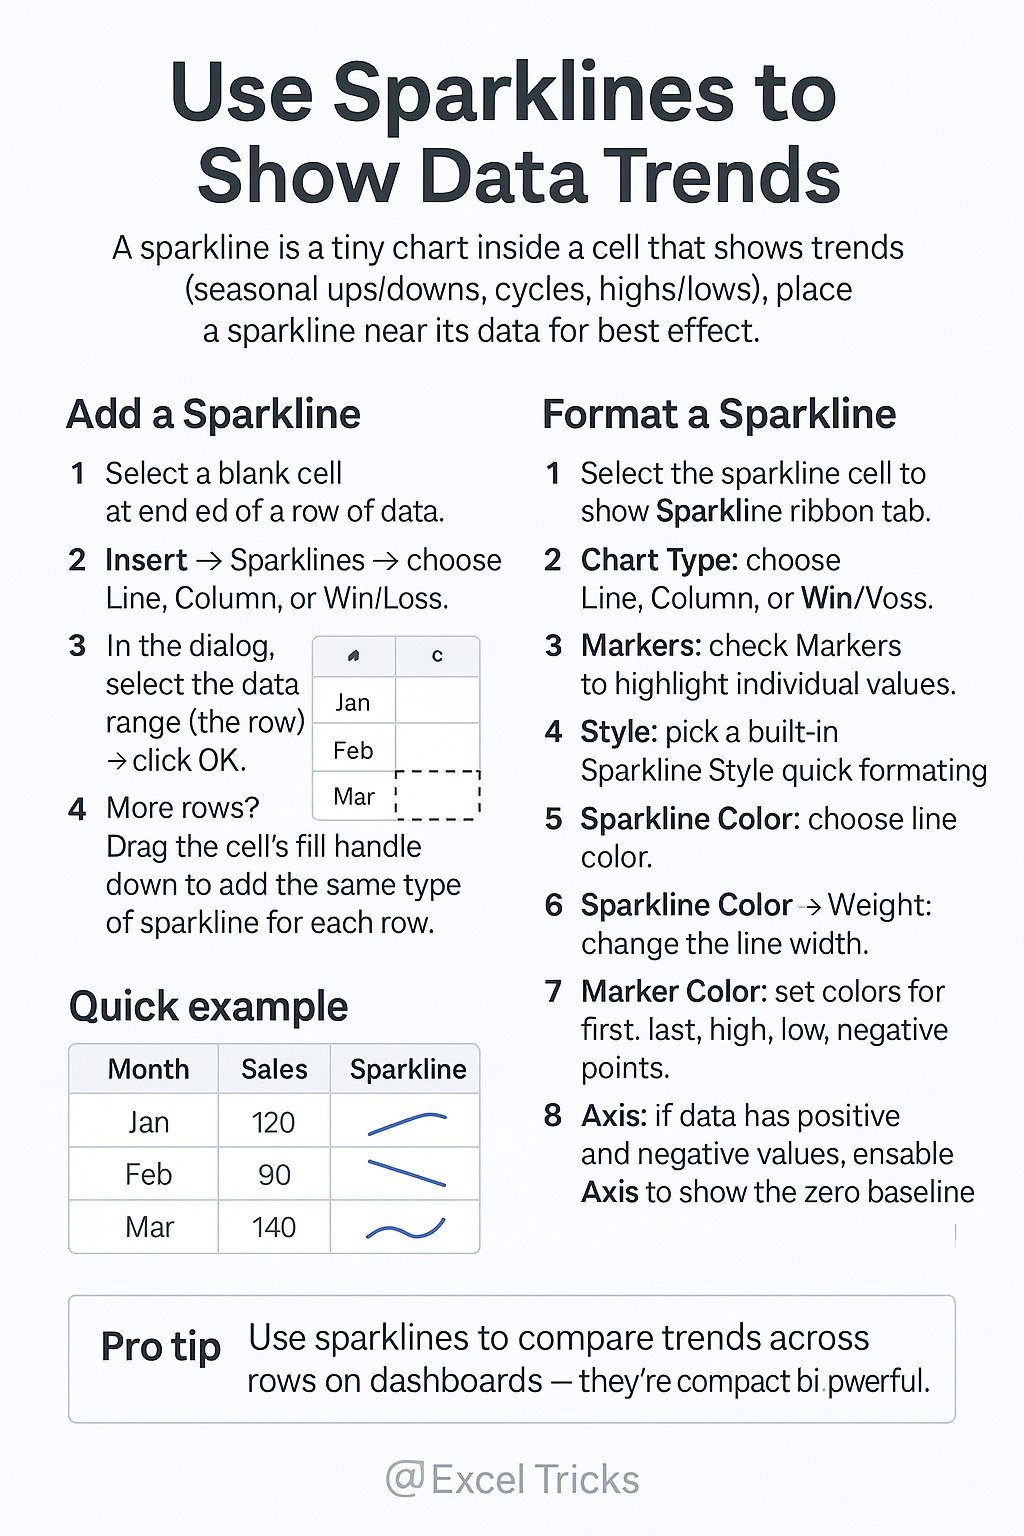
➤ How to Add a Sparkline
- Select an empty cell next to the row of data you want to visualize.
- Go to the Insert menu and choose a sparkline type (Line, Column, or Win/Loss).
- In the dialog box, select the data range (the row of data) and click OK.
- If you have more rows, drag the cell's fill handle down to apply the same sparkline to the other rows.
➤ How to Format a Sparkline
- Select the cell containing the sparkline to make the Sparkline ribbon tab appear.
- Change the Chart Type to Line, Column, or Win/Loss.
- Add Markers to highlight individual data points.
- Choose a pre-made Style for quick formatting.
- Set the Sparkline Color and Weight (line width).
- Set Marker Color to highlight specific points like the first, last, highest, lowest, or negative values.
- If the data contains both positive and negative values, enable an Axis to show the zero baseline.